-
Common
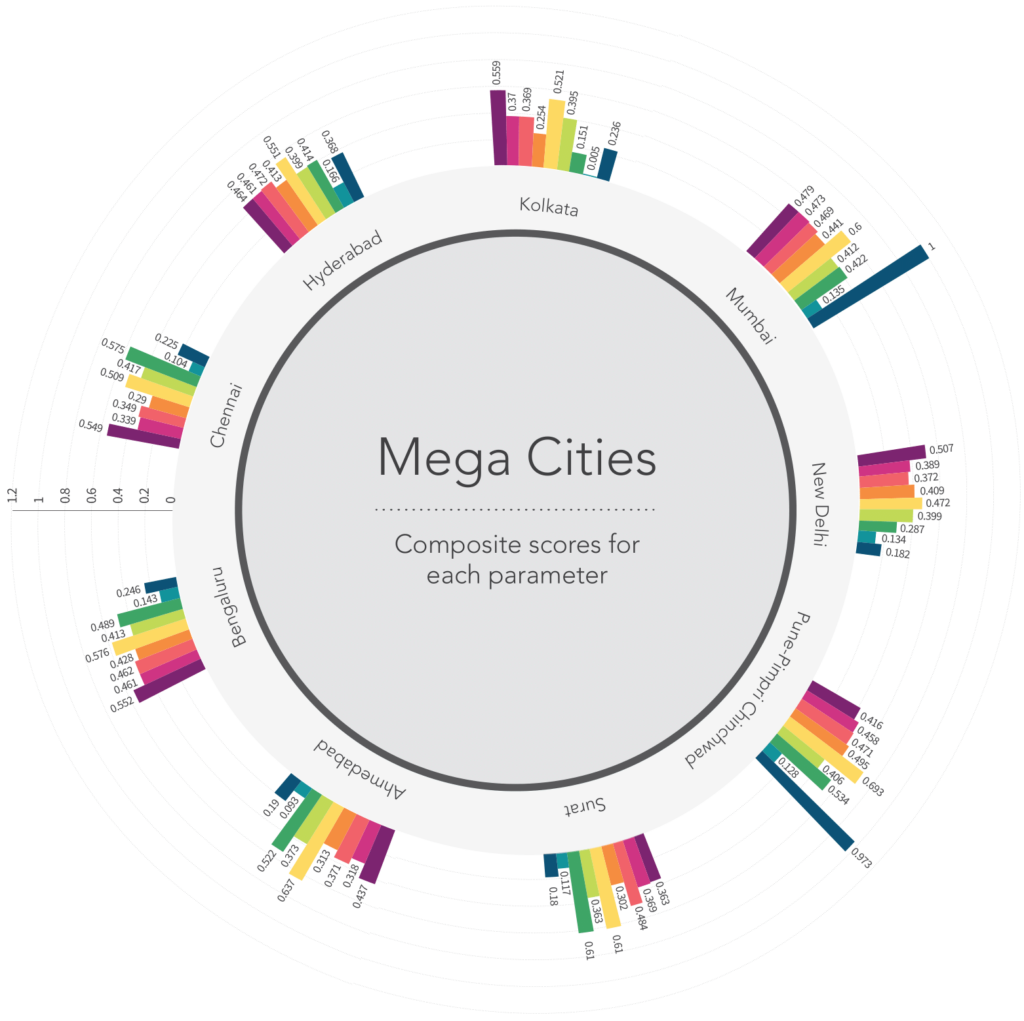
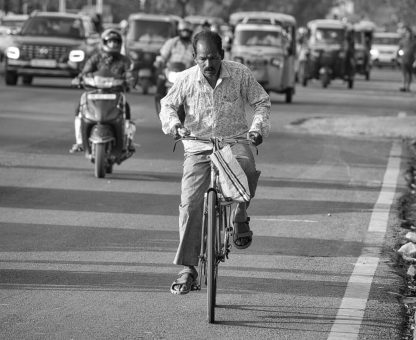
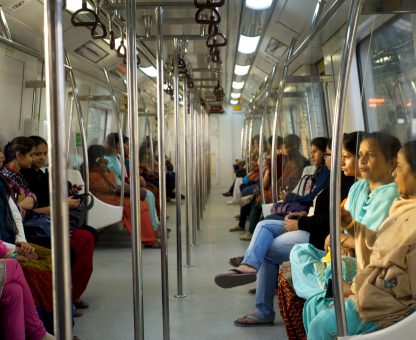
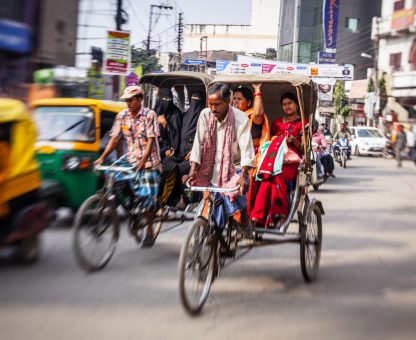
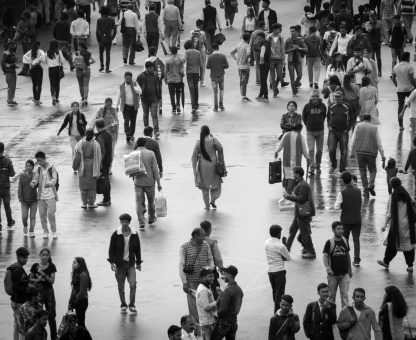
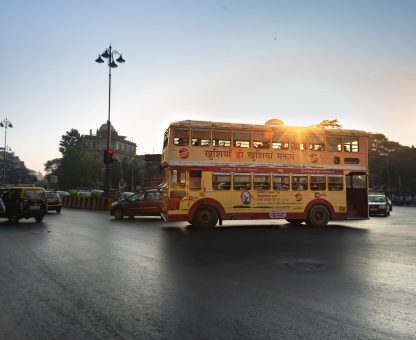
Public transport is the cornerstone of all our mobility initiatives; new businesses driven by digitisation and big data for smarter decisionmaking are reinventing the existing paradigms; the focus should shift away from personal mobility options to all forms of transportation from non-motorised to motorised forms - cycles, rickshaws, two-wheelers, auto-rickshaws, mini buses, buses, and more.
-

Connected
Mobility enables the integration of geographies as well as modes of transport.
-

Convenient
Mobility is safe, affordable, and accessible to all sections of society.
-

Congestion-free
Sustainable mobility should help minimise environmental and economic impact of congestion; it will also lead to greater efficiency in logistics and freight movement.
-

Charged
Mobility can help drive investments across the value chain from batteries to smart charging to electric vehicle manufacturing.
-

Clean
Mobility powered by clean energy leads to better living standards for both - present and future generations.
-

Cutting-edge
Mobility provides immense opportunity for innovation and growth.

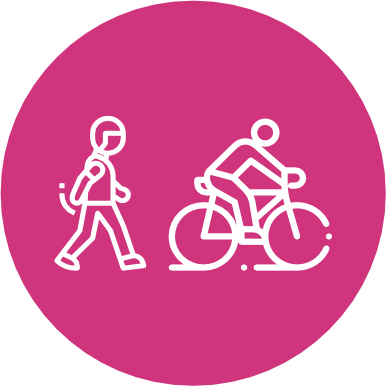
Impetus for Active and Shared Mobility
-
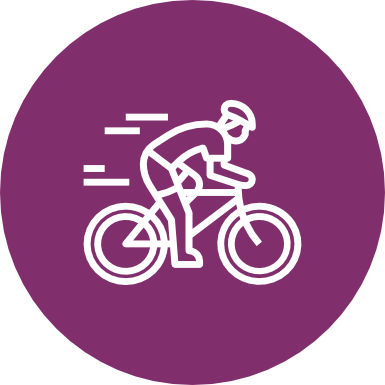
Personal Mobility
Number of personalised motorised two- and fourwheelers per lakh population. Lower the number of personal vehicles, higher the reliance on shared mobility
-
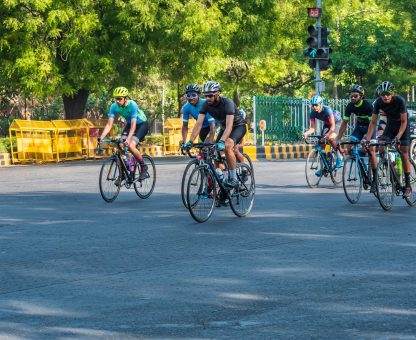
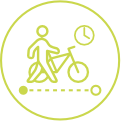
Power of Pedals:
Cycle ownership amongst respondents in the city, seen as an impetus for active mobility
-
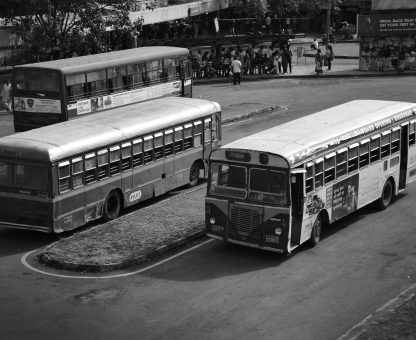
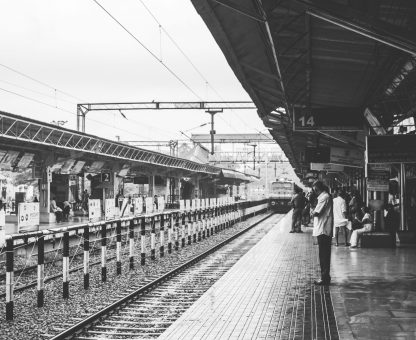
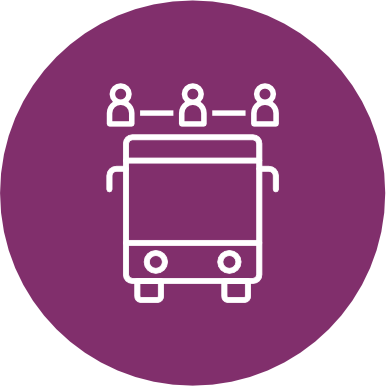
Public Mobility
Sufficient number of buses per lakh population encourages commuters to adopt shared mobility
-
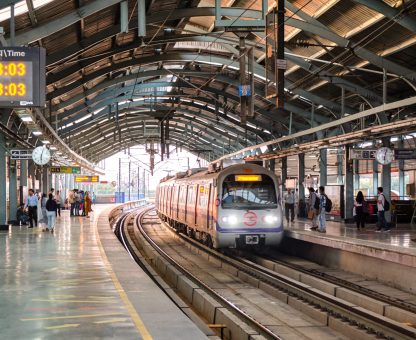
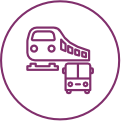
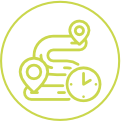
Mass Transit
Length of Bus Rapid Transit and rail-based mass transit infrastructure per lakh population
-
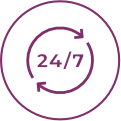
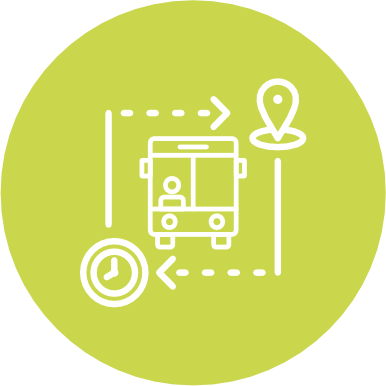
24X7 Mobility
Commuter perception on ease of access to public transport at all times
-
Adoption of Public Transport
Share of commuters stating regular usage of public transport
-
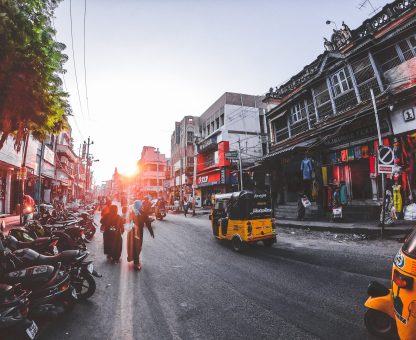
Adoption of Active & Shared Mobility
Stated usage of active and shared mobility

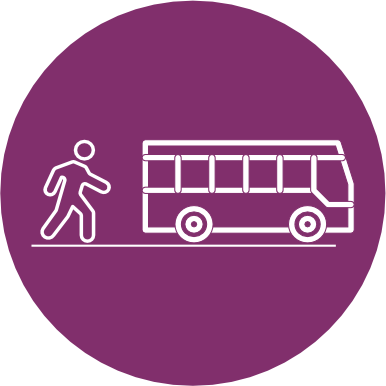
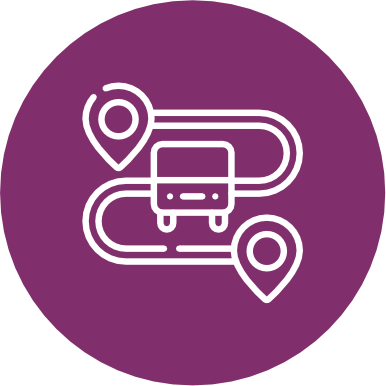
Seamless Mobility
-

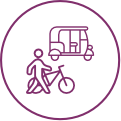
Active First and Last mile Connectivity
Percentage of regular public transport users choosing to walk/cycle to access mass transit.
-
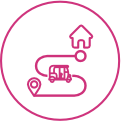
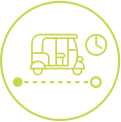
Intermediate Public Transport First and Last Mile Connectivity
Percentage of regular public transport users choosing intermediate public transport to access mass transit.
-

Reasonable Access Time
Commuter response on the average time taken to reach a transit stop.
-
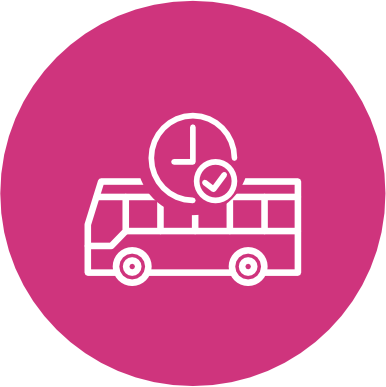
Reasonable Wait Time
Commuter response on the average wait time for public transit.
-

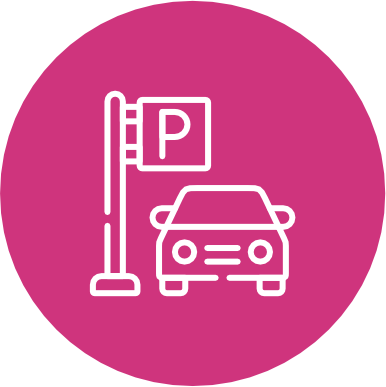
Ease of Parking
Adequate parking facility at transit stops for motorized vehicles and bicycles.
-

Presence of UMTA
Presence of a Unified Metropolitan Transport Authority is crucial to ensure that all mobility modes work in synchronisation

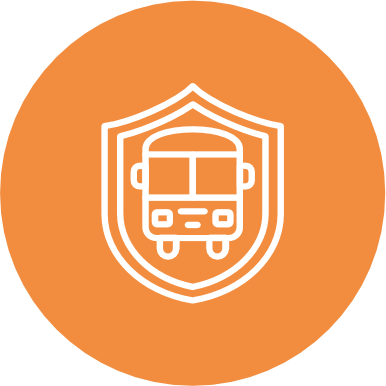
Towards Vision Zero
-

Ease of Walking
Perception on width and maintenance of footpaths
-
Ease of Cycling
Perception on presence of dedicated cycle tracks
-
Ease of Riding
Perception on maintenance of roads
-
Ease of Crossing
Perception on adequacy of foot over bridges/subways at major junctions
-

Well-Lit Roads
Perception on availability of well-lit roads
-
Well-Lit Footpaths
Perception on availability of well-lit footpaths
-
Road Incidents
Derived from road fatalities, fatality rate of vulnerable road users and injuries per lakh population

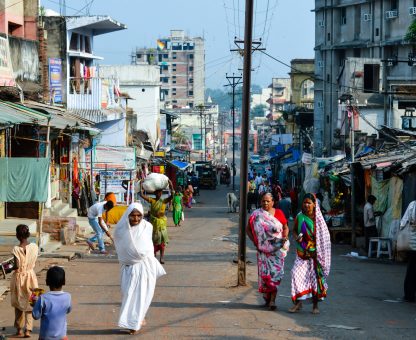
Mobility for all
-
Safe Mobility
Citizen perception about safety from gender and petty crime while commuting
-
Accessible Mobility
Cycle ownership amongst respondents in the city, seen as an impetus for active mobility
-
Gender Inclusivity
Percentage of women and trans/ non-binary community using public transport

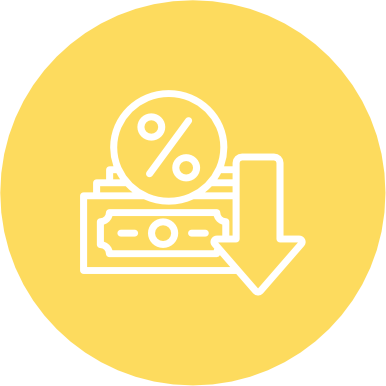
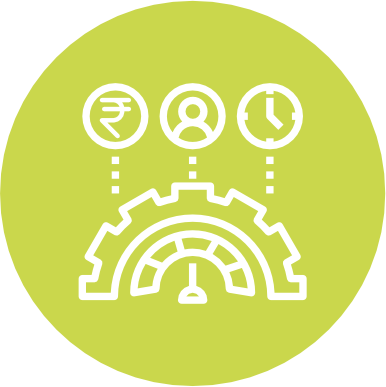
Affordable Mobility
-
Mobility spend
Percentage of total household income spent on individual commute
-
Economical Transit
Percentage of respondents agreeing Public Transport is affordable between any 2 points

Efficient And Reliable Mobility
-
Ease of Information
Easy access to accurate information of public transport and fare
-
Ease of Access (Active Mobility)
Percentage of respondents reaching transit stop in less than 10 minutes by walking/cycling
-
Ease of Access (Shared Mobility)
Percentage of respondents reaching transit stop in less than 10 minutes using shared mobility modes
-
Reasonable Travel Time
Percentage of respondents reaching work place in less than 30 minutes
-

Road Width
Percentage of respondents agreeing roads are adequately wide
-
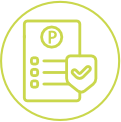
Ease of Parking
Presence of a parking policy and public parking inventory

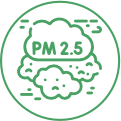
Clean Mobility
-

Air-pollution Related Deaths
Number of deaths caused due to PM2.5 per lakh population
-
Annual PM2.5 Level
Highest PM2.5 level recorded in 2021, as per air quality monitors
-

Incentivising EV Adoption
Presence of an electric vehicle policy in the State/Union Territory
-
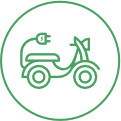
Adoption of Personal Electric Mobility
Percentage of respondents willing to buy an electric vehicle
-
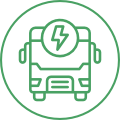
Shift to Electric Buses
Percentage of electric buses in the city (ordered & deployed)
-
Spruced/ Neat Mobility
Percentage of respondents agreeing public transport is clean, hygienic and well maintained

Future Mobility
-
Going Cashless
Percentage of respondents using digital payment modes
-
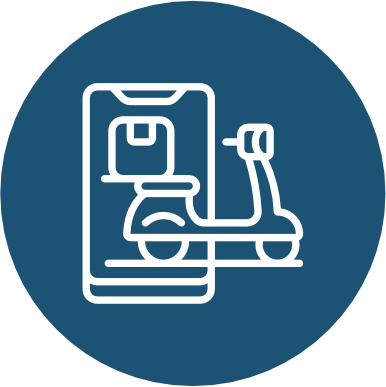
Mobility at Fingertips
Number of respondents using 3 or more apps for mobility
-

Delivery at Fingertips
Number of respondents using 3 or more apps for hyperlocal delivery

Investment in City
-
City Budget per Capital
Based on municipal budgets towards infrastructure
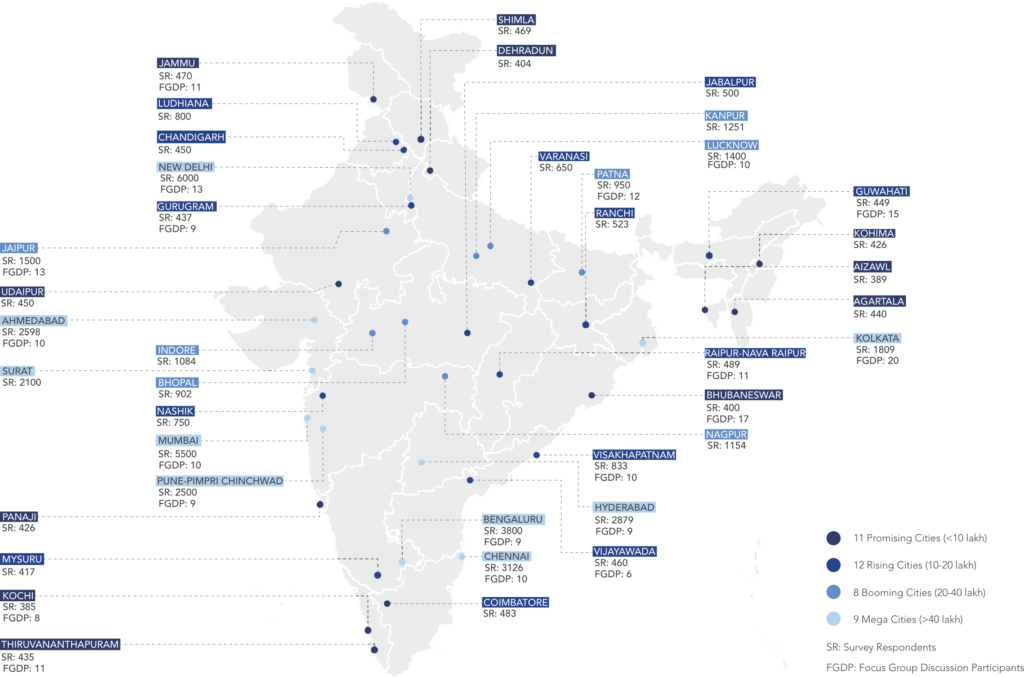

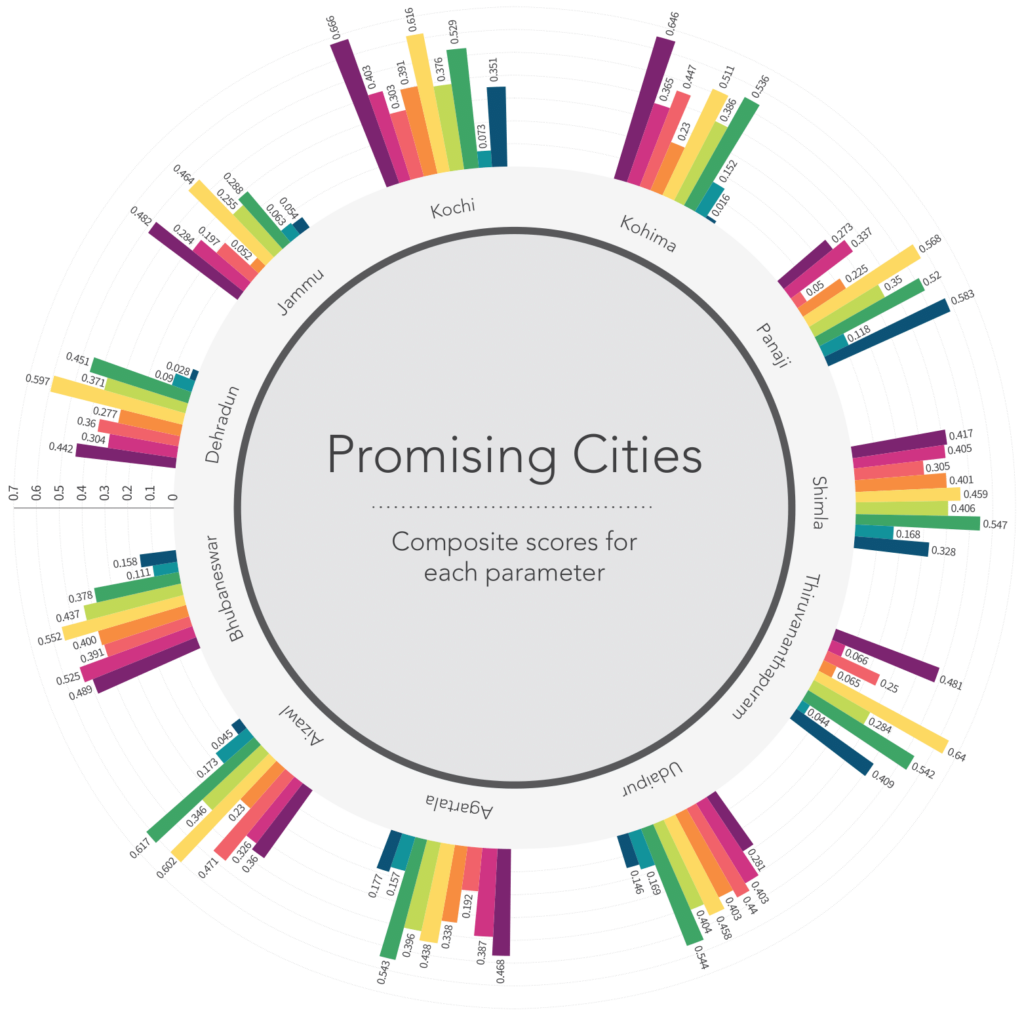
AGARTALA
has the best walking infrastructure
AHMEDABAD
has the highest willingness to adopt electric vehicles
AIZAWL
scores the highest on clean mobility
BHUBANESWAR
has the most seamless mobility system
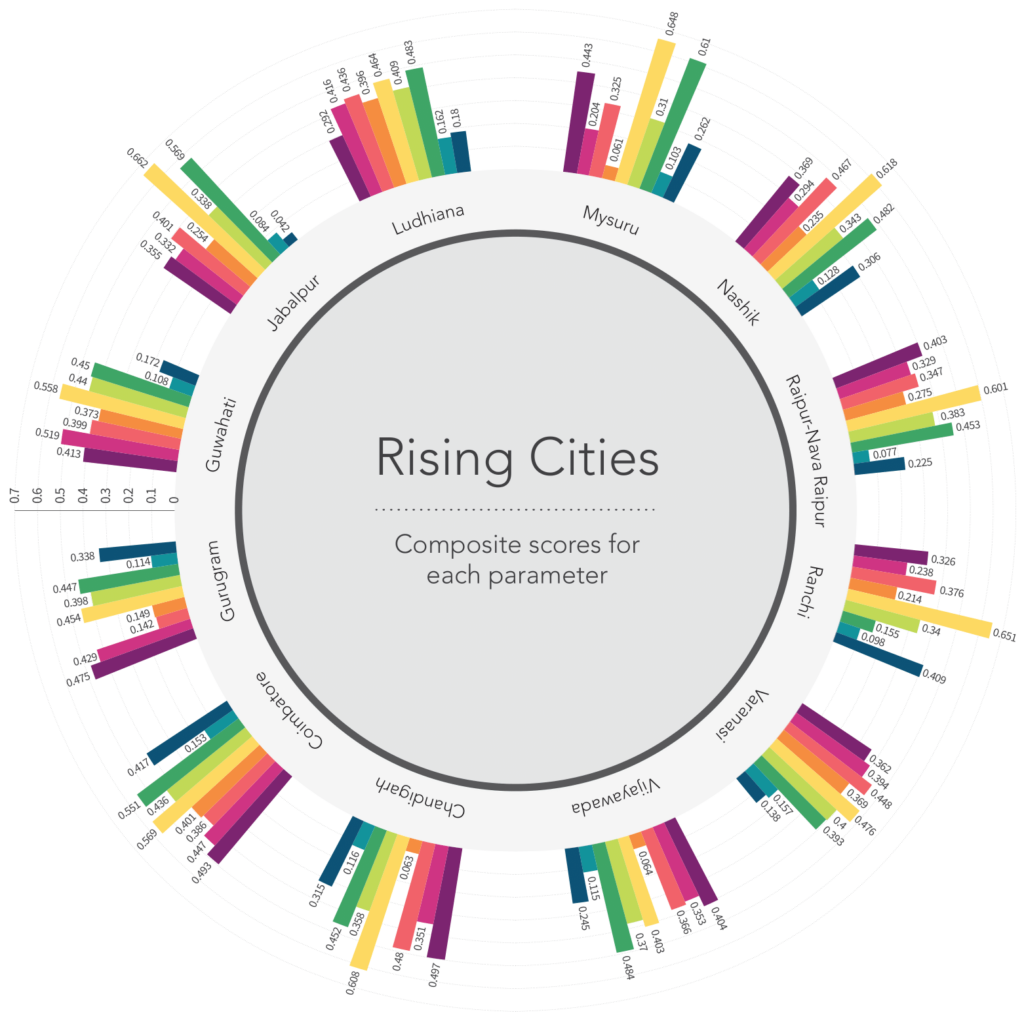
CHANDIGARH
has the highest ease of parking at major transit hubs
COIMBATORE
has the shortest access time to transit stops
DEHRADUN
can access public transit hubs within 10 minutes using Intermediate Public Transport (IPT)
GUWAHATI
has the lowest instances of petty crimes, such as pickpocketing, in public transport
JABALPUR
Mobility spend is lowest
JAMMU
Most people walk and cycle to access public transport
KANPUR
The safest city to travel on public transport
KOCHI
The highest potential for active and shared mobility adoption
KOHIMA
Almost every one in has a bicycle
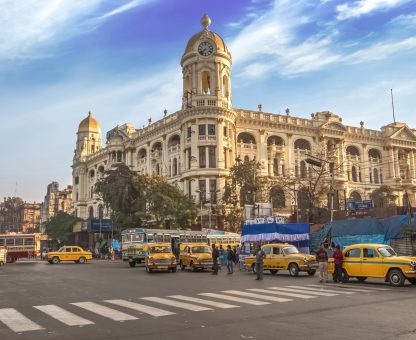
KOLKATA
The highest adoption of shared mobility
LUDHIANA
Public transport usage among women and the trans/ non-binary is the highest
MYSURU
The easiest availability of public transport information
NAGPUR
The most efficient and reliable public transport system
PANAJI
The highest usage of apps for delivery services
PUNE
The most inclusive mobility ecosystem
RAIPUR
Almost everyone uses public transport on a regular basis
SURAT
Perceived to have the safest roads
VIJAYAWADA
The most well-lit roads
Shimla
Kochi
Bhubaneswar
Udaipur
Agartala
Aizawl
Panaji
Kohima
Dehradun
Thiruvananthapuram
Jammu
Coimbatore
Guwahati
Ludhiana
Nashik
Varanasi
Raipur
Chandigarh
Gurugram
Ranchi
Vijayawada
Mysuru
Jabalpur
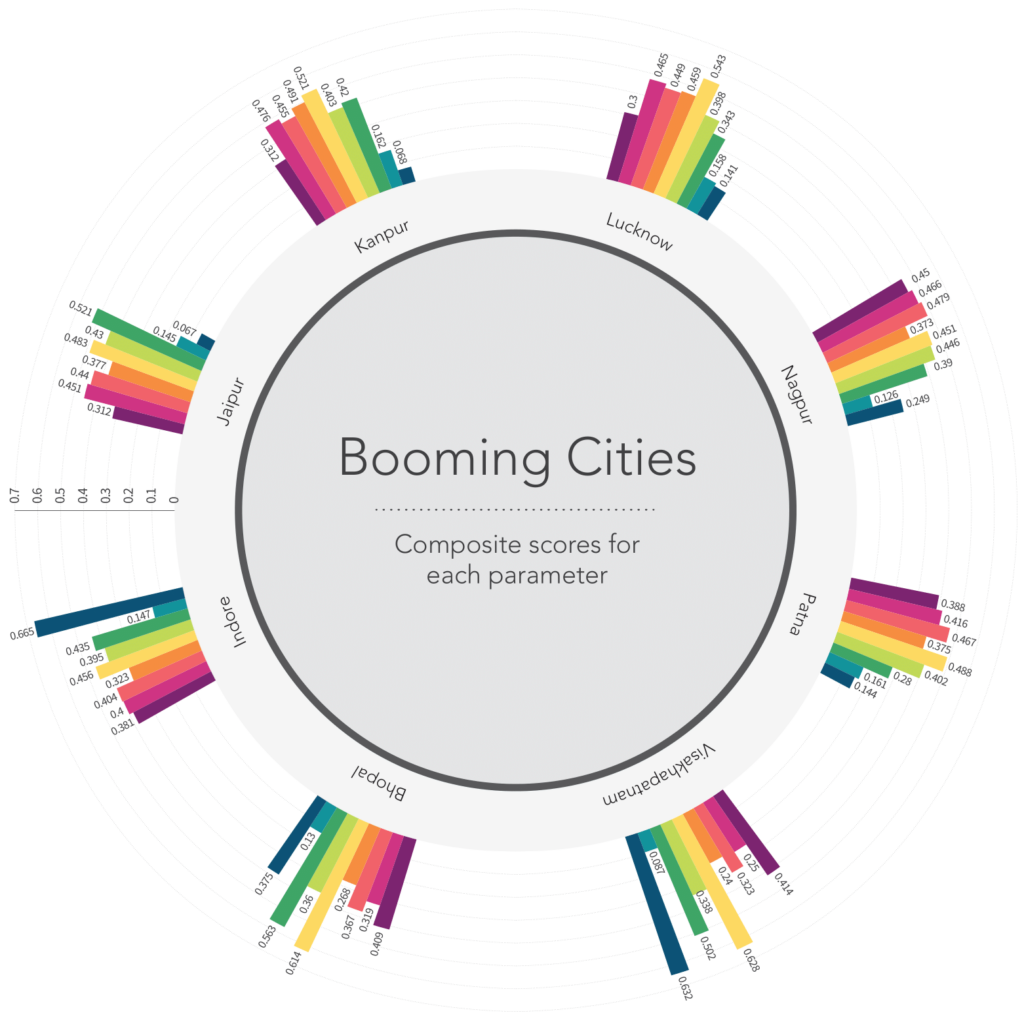
Indore
Nagpur
Bhopal
Lucknow
Visakhapatnam
Patna
Kanpur
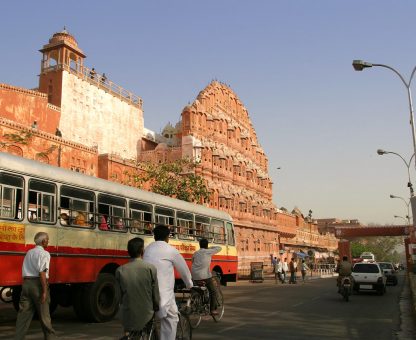
Jaipur
Pune
Mumbai
Hyderabad
Bengaluru
Surat
Chennai
New Delhi
Ahmedabad
Kolkata